


Refresh every 60 sec

Welcome to the Trackleaders live tracking experience.
The basic function is to show last known positions of tracking devices over a live map, including route and/or race specific information and analysis. Individual Riders are represented by icons on the map. Click on the icons for more information on that Rider. A sidebar gives a list of all Riders with zoom controls and links to individual tracking history pages.
A few tips:
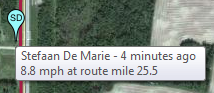 Time stamps: Keep in mind that the positions shown are the latest available. Trackers send out signals at intervals, ranging from every 2.5 minutes to every 10 minutes. The position shown is the most recent reported, and not necessarily the current position. Pay attention to the time stamps!
Don't Panic: No news is good news. Just because a tracker hasn't reported a new point recently does not mean anything is wrong. Trackers will stop transmitting when stopped, if batteries die or for a number of other reasons. Stay calm and keep checking for updates.
 Refresh buttons: Most components in the tracking application either automatically refresh or have their own refresh buttons. This saves having to refresh the entire page in your browser, giving you faster access to the latest data.
 Recommended Browsers: We recommend Google Chrome for the best trackleaders experience. Firefox is good, too. If you're using Safari or Internet Explorer, you should switch, and not just for Trackleaders.
 Check out advanced features like race flow, replay and the leaderboard to dig deeper into the data!
 Share on Facebook
 Course:
REPLAY
Clock:
Speed: x FollowCategory:
Favorites Only

Speed: x Follow
Course:
Category:
Note that all times are computed from SPOT points and are UNOFFICIAL, best estimates only.
Course : Category:
Race flow is a graph of racers progress along the route over time. The x-axis is time and the y-axis is miles covered. You can use this plot to visualize the flow of the race. Some examples of things to look for:
Routes:
█████ 700 - 671.8 mi
█████ 300 - 305.0 mi
Start Time: 06:30:00 AM (PDT) 07/11/26
Start Time: 06:30:00 AM (PDT) 07/11/26
Start Time: 06:30:00 AM (PDT) 07/11/26
Start Time: 06:30:00 AM (PDT) 07/11/26
Start Time: Varies
Faded Icon = Last Point more than 30 minutes old.
Oregon Timber Trail 2026

An unofficial bikepacking challenge on the Oregon Timber Trail. Learn more at: https://ottrace.wordpress.com/
Tracking software by:

Powered by SPOT satellite trackers:

Learn more: findmespot.com
Interested in a SPOT tracker for your race, event or trip? We'd love to hear from you.