
Tour Divide Tracker - Moczynski__Robert

Show split-check locations
 = A stop of more than four hours.
Rookie
from Manitowoc, WI
Moczynski, Robert - Last 10 points
Racer has scratched (dropped out)
#83 on Sun Jun 13 05:28:01 2010 (27 days, 7 hours, 52 minutes ago). 113 feet traveled at 0.1 mph#82 on Sun Jun 13 05:17:29 2010 (27 days, 8 hours, 2 minutes ago). 48 feet traveled at 0.1 mph
#81 on Sun Jun 13 05:07:28 2010 (27 days, 8 hours, 12 minutes ago). 85 feet traveled at 0.1 mph
#80 on Sun Jun 13 04:58:20 2010 (27 days, 8 hours, 21 minutes ago). 6 feet traveled at 0.0 mph
#79 on Sat Jun 12 19:49:19 2010 (27 days, 17 hours, 30 minutes ago). 68 feet traveled at 0.1 mph
#78 on Sat Jun 12 19:39:19 2010 (27 days, 17 hours, 40 minutes ago). 49 feet traveled at 0.1 mph
#77 on Sat Jun 12 19:30:58 2010 (27 days, 17 hours, 49 minutes ago). 4.91 mi traveled at 7.3 mph
#76 on Sat Jun 12 18:50:52 2010 (27 days, 18 hours, 29 minutes ago). 1.29 mi traveled at 6.7 mph
#75 on Sat Jun 12 18:39:25 2010 (27 days, 18 hours, 40 minutes ago). 6.71 mi traveled at 10.8 mph
#74 on Sat Jun 12 18:02:08 2010 (27 days, 19 hours, 17 minutes ago). 4.27 mi traveled at 7.8 mph
#73 on Sat Jun 12 17:29:27 2010 (27 days, 19 hours, 50 minutes ago).
Audio call ins
Moczynski, Robert call in feed on MTBCast (RSS)Checkpoint times
| Name | Time |
|---|---|
| Elkford | 23:39 |
| US Border | scratch |
| Whitefish | scratch |
| Lincoln | scratch |
| Butte | scratch |
| Lima | scratch |
| Island Park | scratch |
| Flagg Ranch | scratch |
| Boulder | scratch |
| Atlantic City | scratch |
| Rawlins | scratch |
| Steamboat Spgs | scratch |
| Silverthorne | scratch |
| Salida | scratch |
| Del Norte | scratch |
| Abiquiu | scratch |
| Cuba | scratch |
| Pie Town | scratch |
| Silver City | scratch |
| Antelope Wells | scratch |
Statistics
Distance to next waypoint (US Border ) = 62.41 milesEstimated arrival time at US Border = Sun Jul 11 03:11:49 2010 (13:51 from now)
At mile 200.2 of race route, route average speed = 4.5 mph
Route miles per day = 108.0
SPOT distance = 169.96 miles, SPOT Average speed = 3.84 mph
Speed plot:
Speed vs time plot:

Race Coverage
TD Main (Group) TrackerRace Updates
Split Projection Chart
Discuss the Race
Race Replays
Call-in Audio (MTBcast)
Official Race Site
2009 Tracker / Historical

Individual Maps
Arnold, Mathew (Focus)
Baker, Forest (Focus)
Billman, Jon (Focus)
Bird, Marshal (Focus)
Blumenthal, Dave (Focus)
Butler, Cricket (Focus)
Crosby, Grant (Focus)
Foster, John (Focus)
Goldberg, David (Focus)
Harding, Aidan (Focus)
Huddle, Stephen (Focus)
Lee, Matthew (Focus)
Lobeck, Erik (Focus)
Moriarty, Tom (Focus)
Nelson, Eric (Focus)
Nester, Blaine (Focus)
Perry, Brad (Focus)
Preston, Dave (Focus)
Prochaska, Mike (Focus)
Richert, Derek (Focus)
Senie, Nicolas (Focus)
Sheppard, Shawn (Focus)
Tremblay, David (Focus)
Tsai, Patrick (Focus)
Active Trackers
Allegheny Mountains Loop 2024 - 400 and X
Candice Burt Arizona Trail FKT 2024
Arizona Trail Race Spring ITTs 2024

Bighorn 100 - 2024

Great Divide MTB Route Touring Tracker

Florida Divide 2024

Great American Ride (Virtual) - 2024
Great Northern Bikepacking Route

Heywood 390 2024
Highland Trail 550 2024
Pacific Coast Bike Race 750 - 2024

Pinyons and Pines 2024

Race across Arizona 2024

Rockstar VA 270 2024
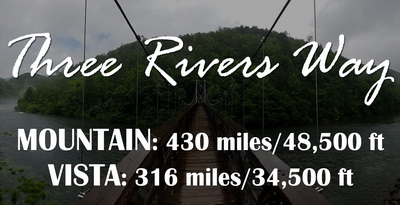
Three Rivers Way: Vista / Mountain Routes 2024
Tumbling Diaries